Formula D
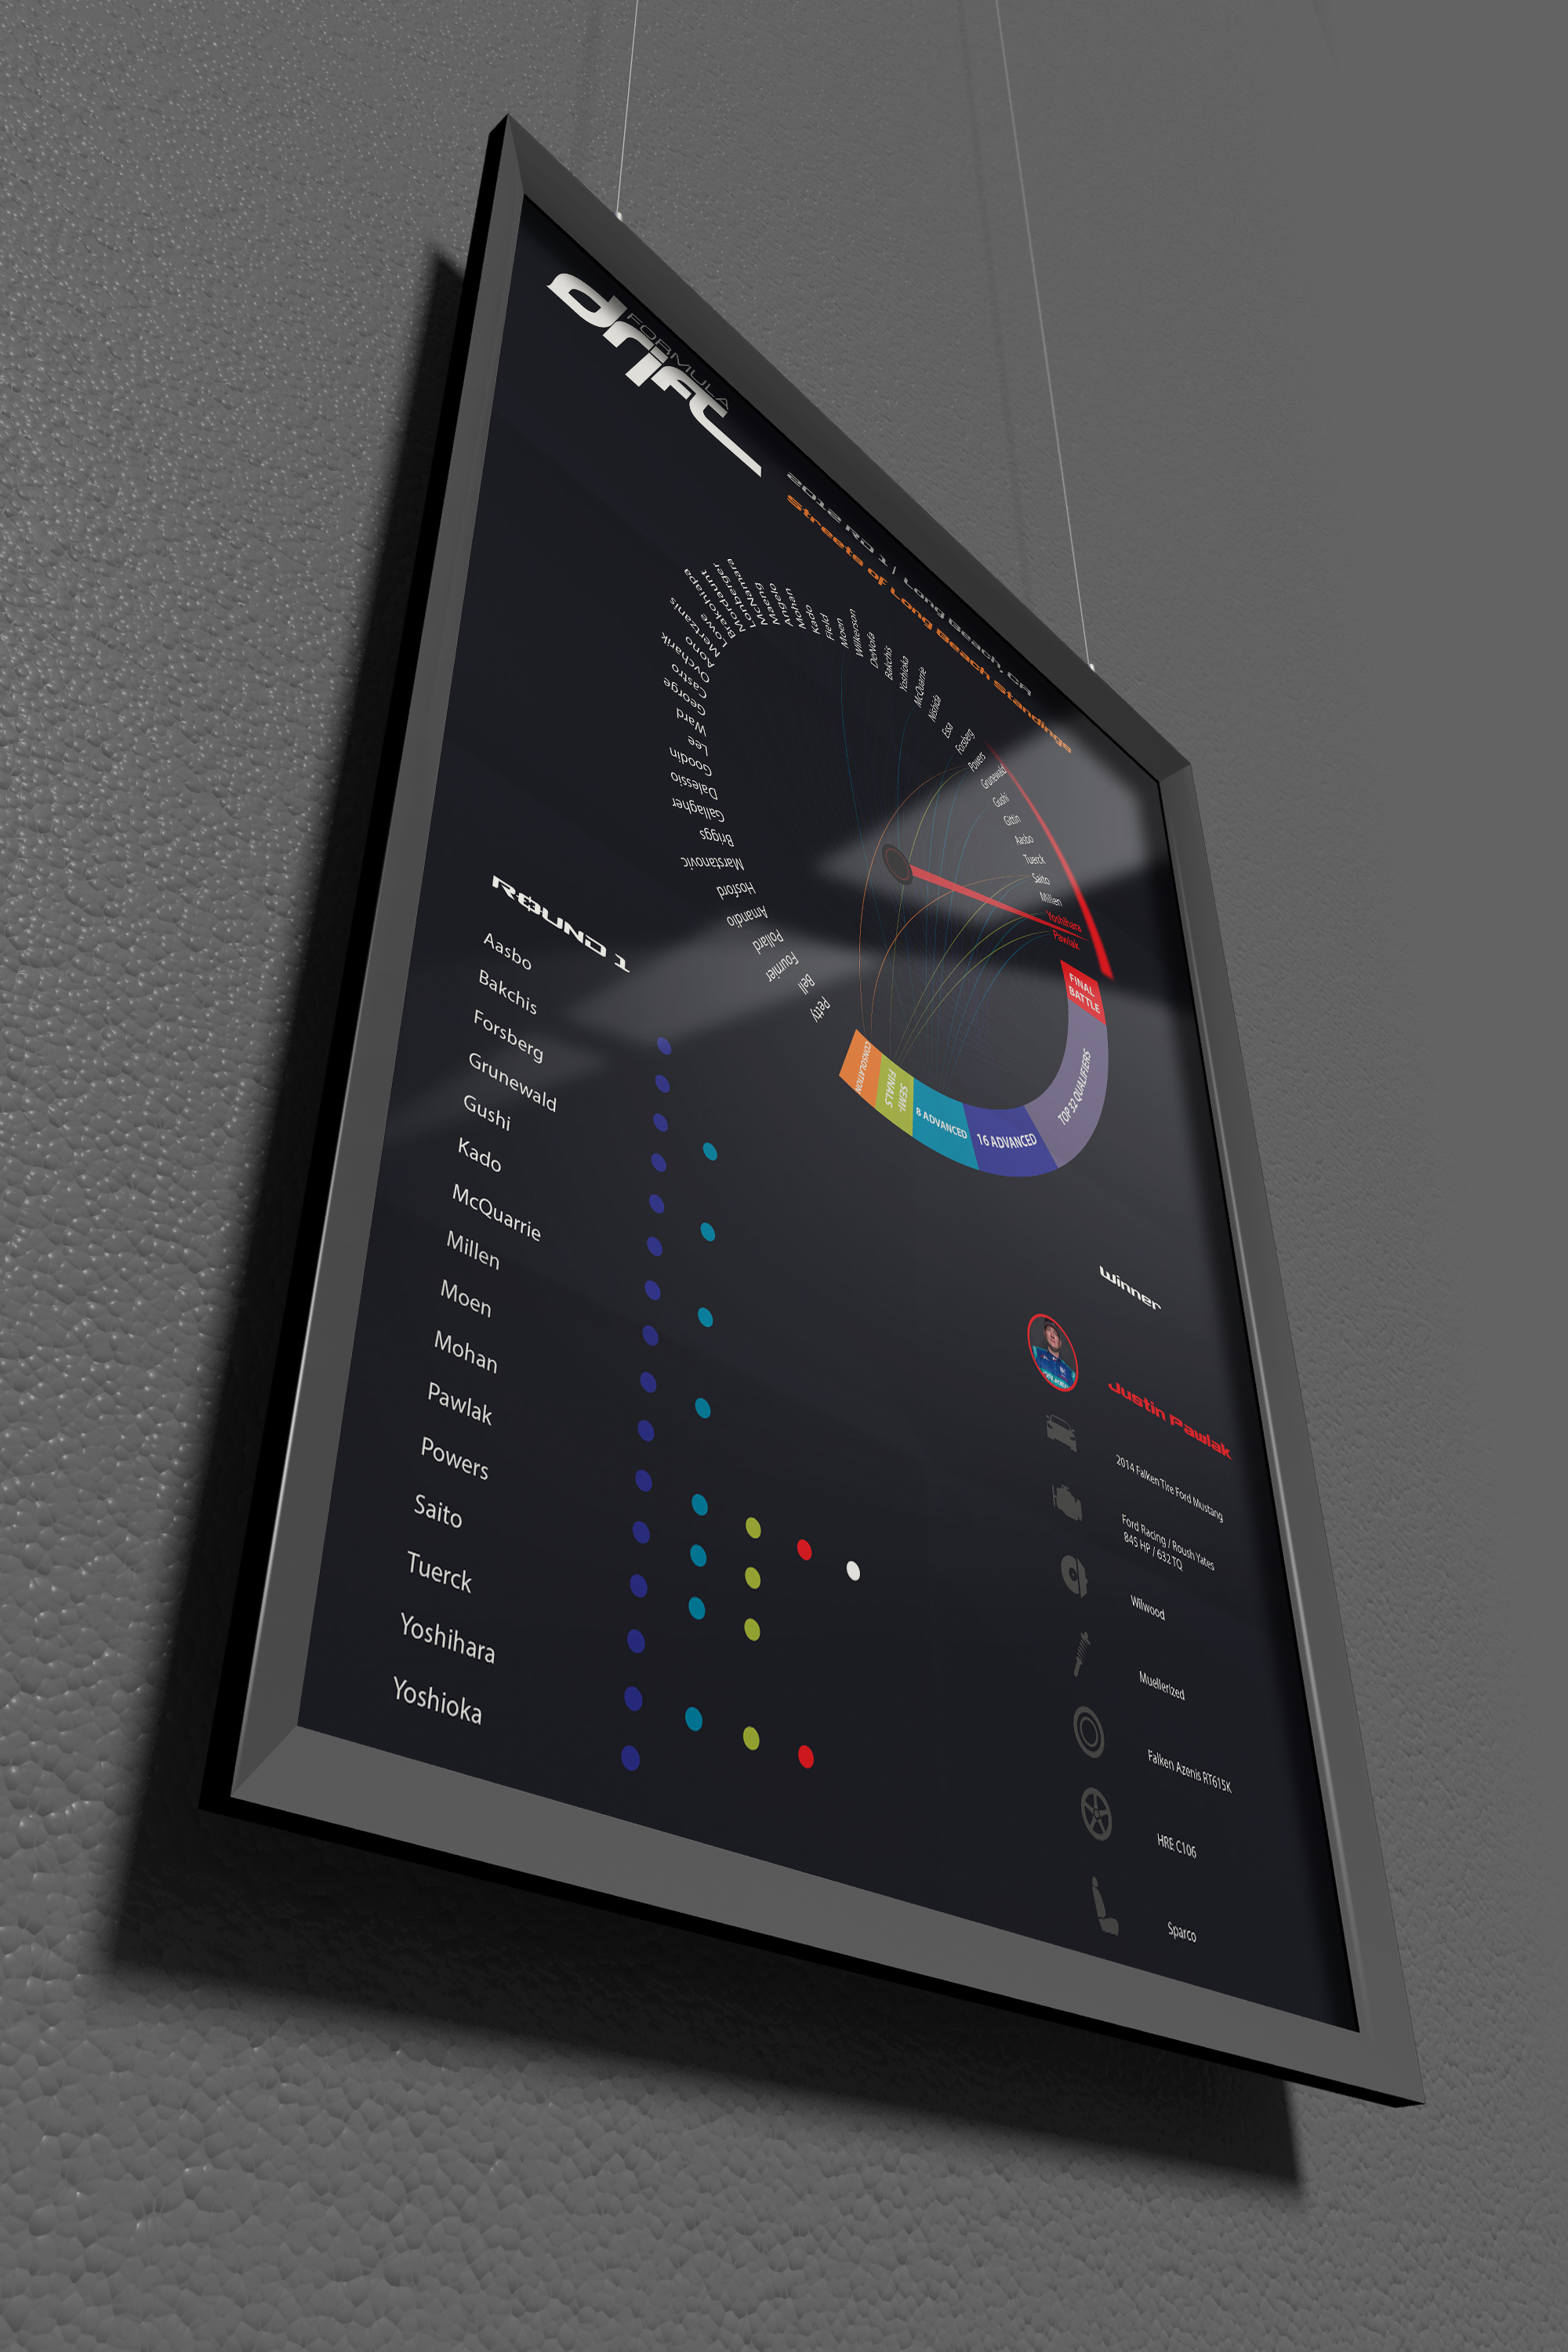
An advanced data visualization of one of Formula Drift's competition series, displaying each competitor's advancement through the tournament.
Formula D is North America’s first official drifting competition series that started out in 2003 by Jim Liaw and Ryan Sage. Where the fastest time is not as relevant as the execution and style. The “F” of Formula D symbolizes them as the first drifting championship to have factory backed teams, first official and sanctioned competition on city streets, first to be aired on national cable, and first to be filmed and featured in HD and 3D.
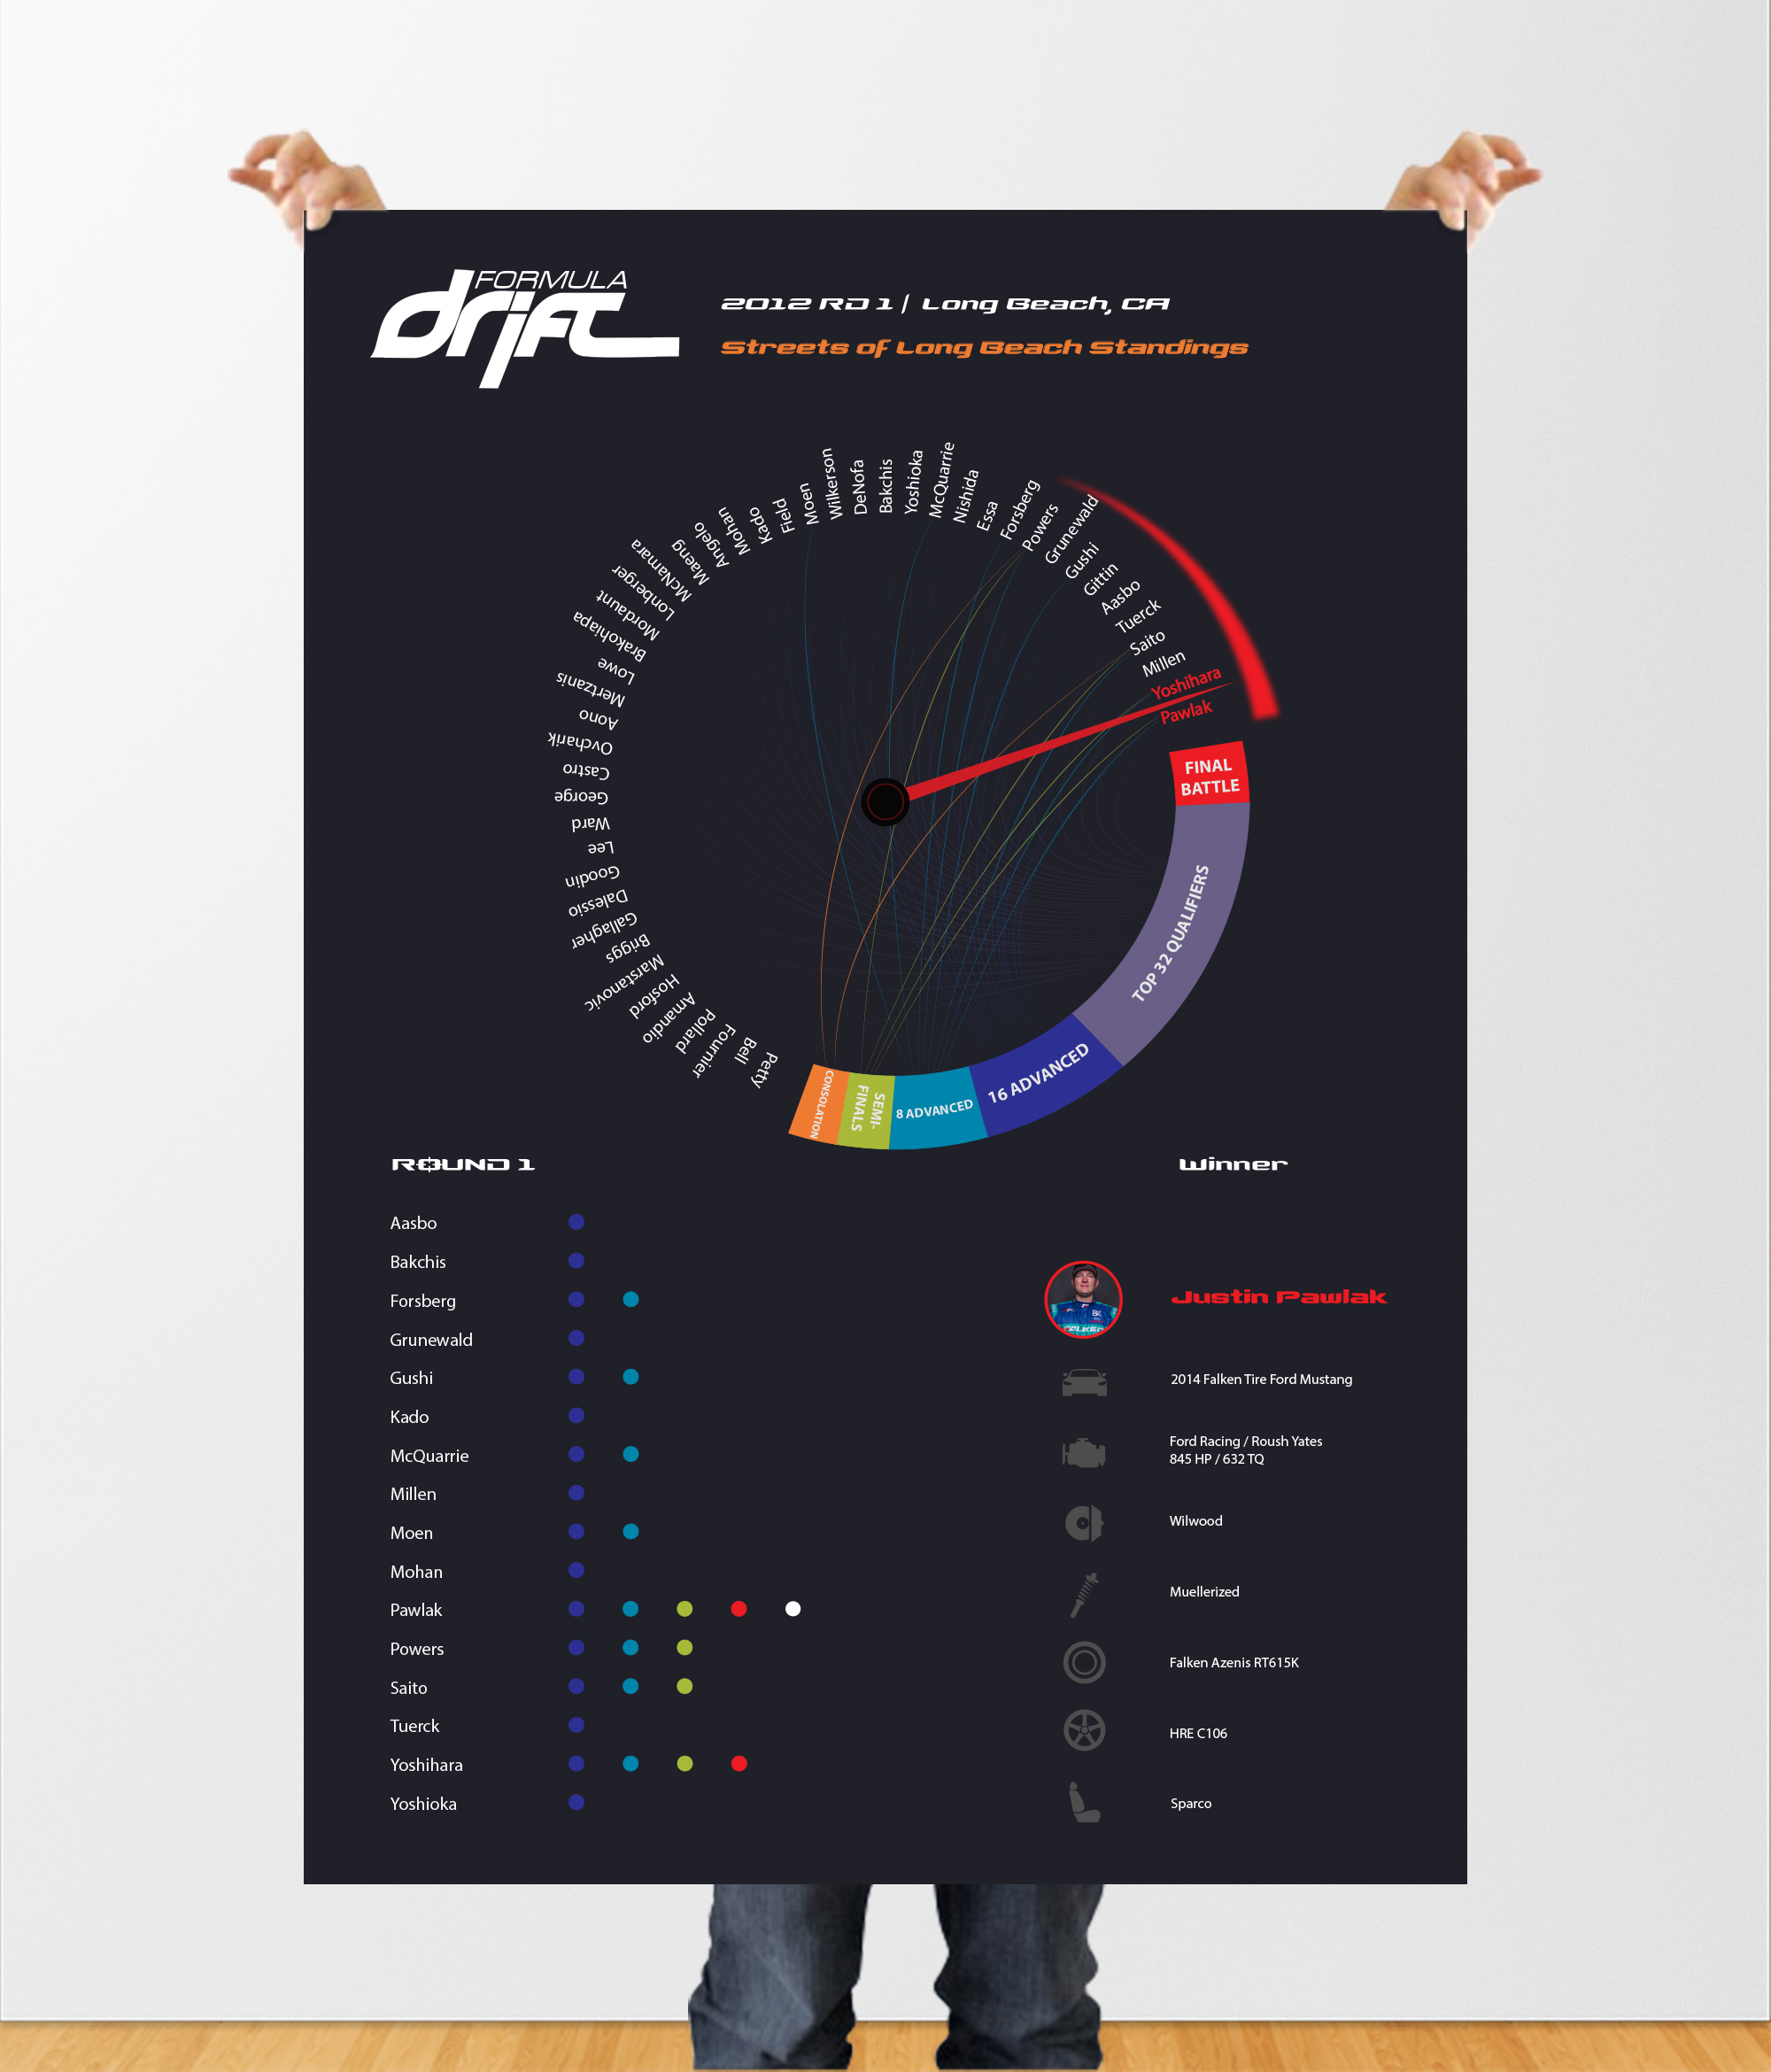
I originally wanted to make this a interactive advanced data visualization. Example of one of the interactive features would be to roll over each name or round to display how far they were able to advance each stages of the tournament. I ended up wanted to keep it simple with just having all the lines connect but increase the opacity of the higher advancements.